

Read the Analytics page
Who can do this: Owners, Office Managers and Billing. Analytics doesn’t appear in the left menu for anyone else. If you can’t see it, ask your office manager.
Click Analytics in the left menu, then pick one office in the office picker at the top left. Analytics works one office at a time. With every office selected, the page asks you to pick one.
Ask NixDent can explain any report you open here. See Ask NixDent: ask about your practice.
The numbers come from your Open Dental data. If you see This location isn’t connected to Open Dental, or a note that live analytics need query access in Open Dental, contact NixDent.
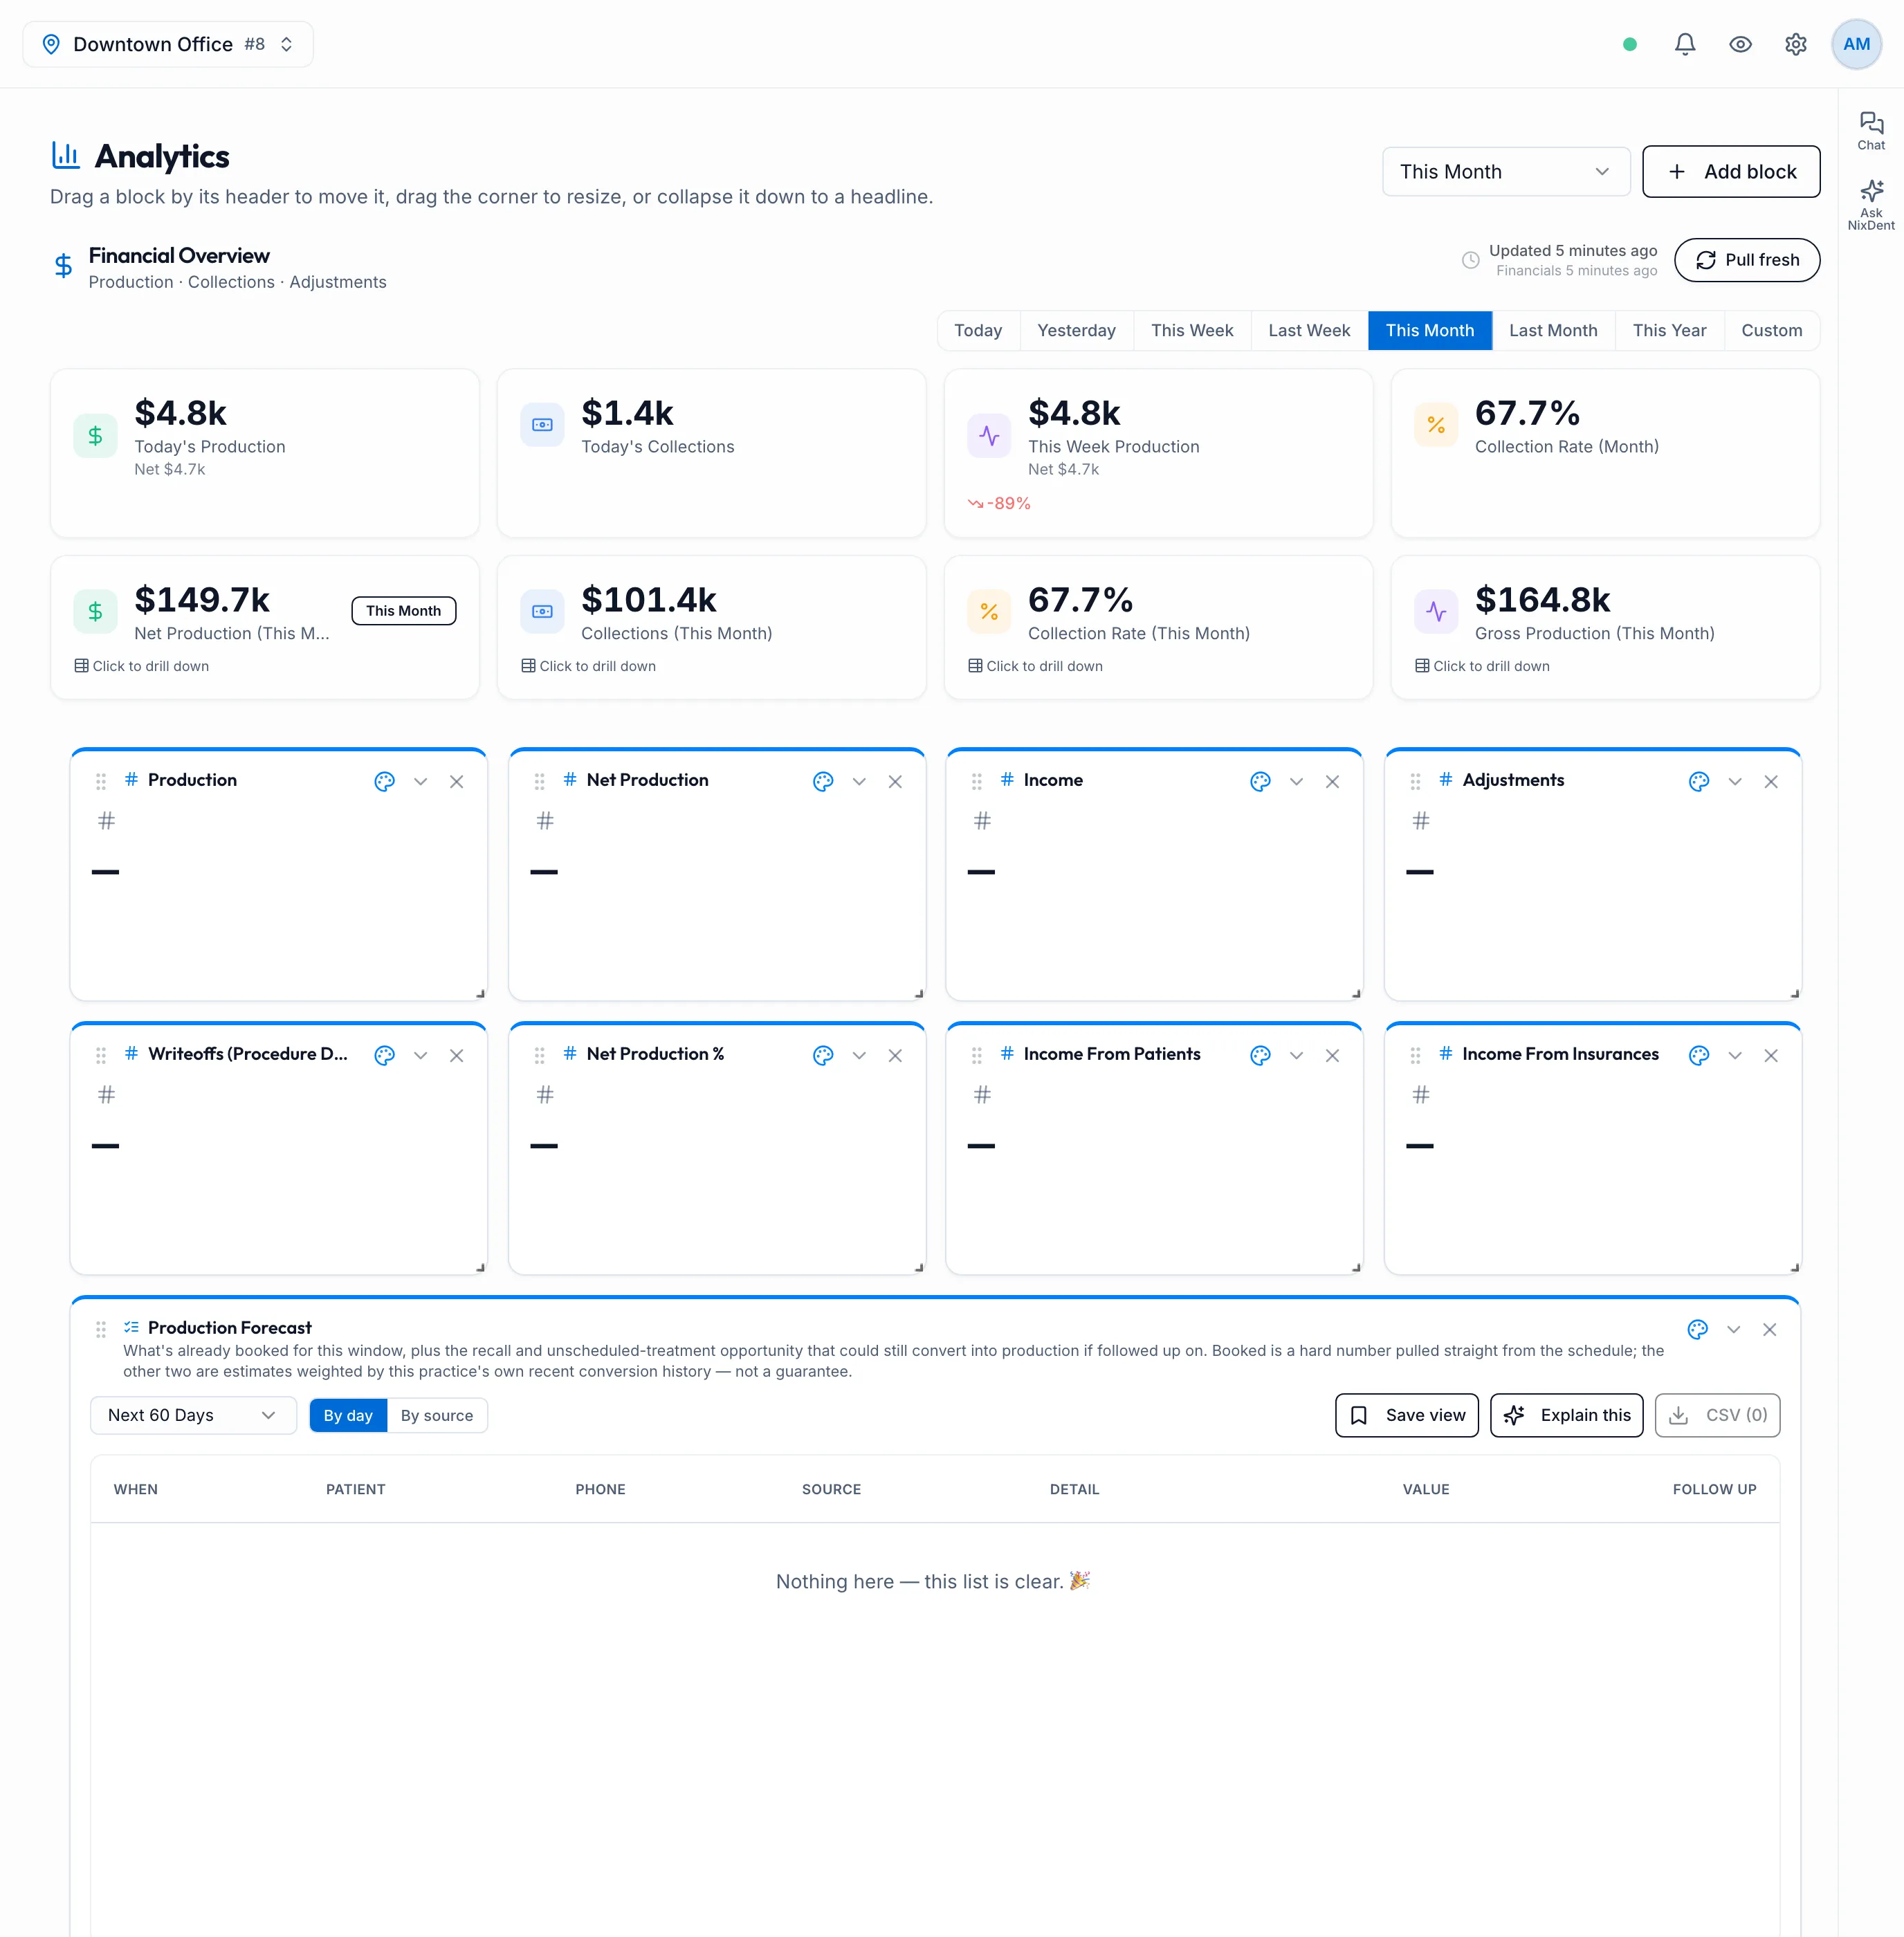
Financial Overview
Section titled “Financial Overview”The top of the page shows your core money numbers.
- Updated … tells you how fresh the figures are. Click Pull fresh to fetch the latest from Open Dental. It can take several minutes. The button shows Refreshing… until it’s done. Pull fresh is only on this page.
- The first row is always the same: Today’s Production, Today’s Collections, This Week Production and Collection Rate (Month). The small arrow compares today with yesterday, and this week with last week.
- The second row follows the date buttons: Today, Yesterday, This Week, Last Week, This Month, Last Month, This Year or Custom. It shows Net Production, Collections, Collection Rate and Gross Production for that period.
Click any card in the second row to open the Financial Breakdown: a month-by-month table of gross production, adjustments, net production, collections and collection rate.
What the numbers mean
Section titled “What the numbers mean”| Number | What it is |
|---|---|
| Gross Production | The fees for procedures completed in the period, by procedure date. |
| Adjustments | Adjustments posted in Open Dental in the period. Discounts and other reductions are negative. |
| Net Production | Gross production, plus adjustments, minus insurance write-offs. |
| Collections | Money received in the period: patient payments plus insurance payments. |
| Collection Rate | Collections divided by net production. Shows n/a when net production is zero or below. |
Negative net production, or a collection rate over 100%
Section titled “Negative net production, or a collection rate over 100%”Both are normal and don’t mean something is broken.
Production is counted on the day the procedure was done. Insurance payments and insurance write-offs are counted on the day the insurance payment was received. So the two sides of the same visit can land in different periods.
- Net production below zero: in a short period (a slow day, or the first days of a month), write-offs for work done earlier can arrive while little new production has been completed. The write-offs are larger than the new production, so net production dips below zero, and collection rate shows n/a.
- Collection rate over 100%: you collected payments for work done in an earlier period. Collections can then be larger than this period’s net production.
Longer periods, such as a month or a quarter, even this out.
The headline strip
Section titled “The headline strip”A strip of headline numbers scrolls across the page: production and collections this month, what’s on the books for the next 30 days, unscheduled treatment, overdue hygiene, patients seen with no next visit, cancellation rate, new patients, AR outstanding, case acceptance, fee realization, patient attrition and recall compliance. Numbers in amber need attention.
Hover to pause it. Click a number to open the report behind it.
Your board of blocks
Section titled “Your board of blocks”Below the strip is your own board. It starts with eight numbers (Production, Net Production, Income, Adjustments, Writeoffs (Procedure Date), Net Production %, Income From Patients and Income From Insurances) and two reports (Production Forecast and Unscheduled Treatment).
- Pick the period with the menu at the top right, next to Add block. It sets the period for every number block. Report blocks have their own period.
- Add something: click Add block, then choose from Metrics or Reports.
- Move a block by dragging its header. Resize it by dragging its bottom-right corner.
- Collapse a block down to its headline, change its color, or remove it with the buttons in its header.
- Change view on a number block switches between the number, a bar per provider, and a trend line.
- See the transactions behind a number by clicking it. They open in their own window, and your board stays as it was.
NixDent remembers your board in this browser only, so it looks different on another computer or after you clear site data. On a phone, blocks are shown one under another and can’t be moved.
Metrics you can add
Section titled “Metrics you can add”| Metric | What it is |
|---|---|
| Production | Fees for completed procedures in the period |
| Scheduled Production | Planned production on appointments scheduled in the period |
| Projected Production | Production completed so far, plus what’s scheduled for the rest of the period |
| Adjustments / Discounts | All adjustments / only the reductions |
| Writeoffs (Procedure Date) / Writeoffs (Payment Date) | Insurance write-offs, counted by the procedure’s date or by the insurance payment’s date |
| Income From Patients / Income From Insurances / Income | Patient payments / insurance payments / both together |
| Net Production | Production plus adjustments minus write-offs (procedure date) |
| Net Production %, Adjustments %, Writeoffs % | Each as a share of production |
| Income % | Income as a share of net production |
| Days in AR | Everything owed to the practice today, divided by your average daily production over the last 90 days |
| Open chair hours (est.) | Provider scheduled hours minus booked appointment time |
| App-booked appts | Appointments booked through NixDent in the period |
Reviews
Section titled “Reviews”At the bottom of the page is a summary of your review requests. Click Open full page to go to Reviews.